
Try it like this
Before committing significant capital to photovoltaic equipment or engaging commercial sales contractors, understanding your property's physical solar potential provides the objective basis required for informed decision-making. Rooftop solar generation depends fundamentally on geographical solar irradiance, roof orientation, tilt angle, and site-specific shading.
Orientation, Azimuth, and Seasonal Radiation Curves
The European Commission's PVGIS tool estimates solar electricity yield from location, orientation, slope, and weather data. In many Northern Hemisphere locations, a south-facing roof produces a strong annual total; an east–west arrangement can spread generation across more of the day. Southern Hemisphere sites need the opposite orientation check.
- Record your roof orientation and tilt, but compare the calculator's scenarios instead of assuming one ideal angle works everywhere.
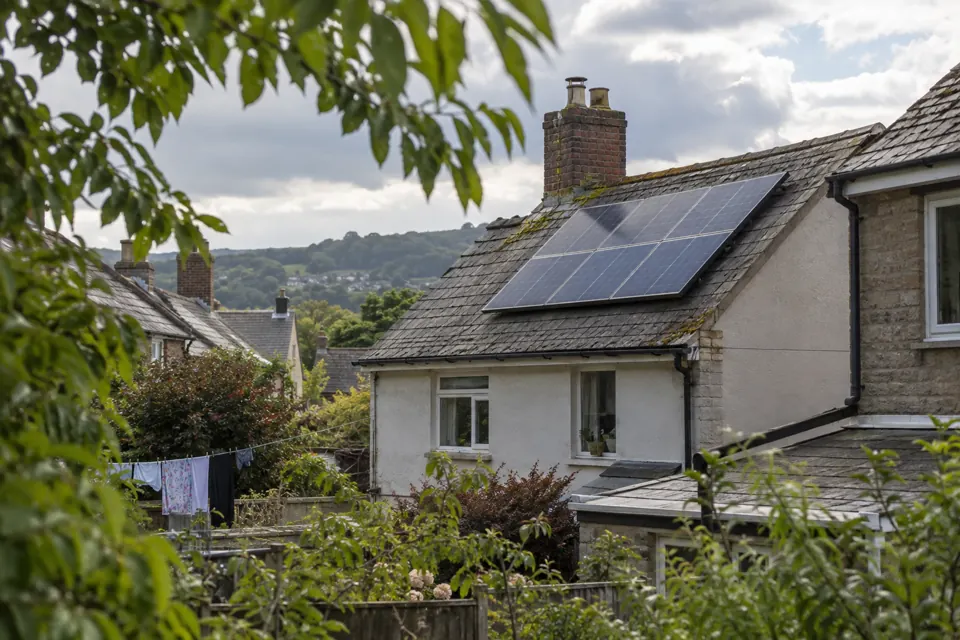
- Inspect potential shade obstructions—including chimneys, dormer windows, neighboring buildings, and tall mature trees.
- Compare peak summer monthly generation against low winter output to understand the seasonal imbalance of solar energy.
- Evaluate roof age, structural integrity, and tile condition before installing mounting hardware designed for twenty-year lifespans.
Self-Consumption and Household Economics
The value of residential solar depends on local prices, export rules, the system design, and how much electricity a household uses while the panels are producing. In many markets, shifting flexible loads such as laundry or water heating toward sunny hours can increase self-consumption, but local tariffs should decide the economics.
| Parameter | Optimal Northern Hem. Range | Operational Impact | Verification Method |
|---|---|---|---|
| Roof Azimuth | True South (180°), or East-West split | South yields highest annual kWh; east-west matches morning and evening home use | Compass or aerial map check |
| Roof Pitch / Tilt | 30° to 35° (latitude dependent) | Steeper pitch favors winter sun; shallower pitch captures peak summer sun | Inclinometer smartphone app or roof plan |
| Shading Obstacles | Unshaded between 9:00 and 16:00 | Partial string shading disproportionately reduces conventional string inverter output | Visual shadow watch on sunny days |
| Grid Interconnection | Permitted grid export capacity | Defines maximum system size and feed-in export rules with the local network operator | Consult local Distribution System Operator (DSO) |
Run an open PVGIS assessment
- Open the European Commission PVGIS tool in your web browser and navigate to your home address on the map.
- Start with a small illustrative system size and label it as an example, then compare other sizes only if the tool and installer make the assumptions clear.
- Download or examine the monthly generation chart to view your expected monthly production curve across the year.
Try it like this
Try it like this
- Enter a nearby location in Sustineer’s solar calculator.
- Try a conservative installation size and compare seasonal output.
- Ask a qualified local installer to assess roof, wiring, permissions, and economics.